


The decisions we make as product teams are critical to our capacity for product success. If we can learn to make even slightly better product decisions consistently, we can reap the rewards of those optimizations well into the future.
But how can we make sure decisions are rooted in solid evidence instead of gut instinct? Enter the world of experimentation, the gold standard for data-driven decision-making.
Even though most product teams claim to follow a data-driven process, it's clear from the product people I talk to, when it comes to having a systematic process for experimentation, we can do much better.
Not only do teams not run enough tests, but many of the tests they are running lack a basis for solid research. Simply ramping up testing velocity (running more tests) won’t fix this. Yes, rapid experimentation has its place, but for many teams, it makes more sense to step back and focus on the quality of the ideas they are running.
Why focus on idea quality before velocity?
Your ideas are your inputs into the testing pipeline. Velocity doesn't mean much if your inputs aren’t high-quality, to begin with. Improving the quality of your ideas is beneficial in a number of ways:
Quality ideas make prioritization much easier. When you can reliably assess ideas qualitatively (i.e. data-driven) the choice becomes pretty clear.
Quality ideas improve the experiment success rate. This is invaluable to agile workflow, and you’re shoring up more resources for future product experimentation and testing.
So how do you come up with high-quality product experiment ideas?
In this post, I'll break down a proven 5-step process I have used with top SaaS companies to generate winning activation and conversion experiments.
It's called a growth product audit, and I'll explain every step of how it works so you can do one yourself.
Product growth audit – a goldmine for experiment ideas

A product growth audit is all about taking an end-to-end look at how your product acquires, activates, and converts users. The goal is to understand what makes your best users, and how to make sure that aha moment happens as quickly and frequently as possible for new user onboarding.
How long does a product growth audit take?
Minimum 2 weeks, but I’d recommend setting aside 3-4. This is not a process you'll want to rush. Again, the focus here is quality insights, not necessarily speed.
Who should run a product growth audit?
Product managers or growth team leads are the best fit to run a product growth audit. In some cases, it might make sense to involve someone from marketing (e.g. if the focus is more top-funnel).
Remember, if you have a user researcher who can help with qualitative research, that’s great, but it’s not totally necessary.
If you have the budget, consider outsourcing the work to a consultant or agency (but be prepared to spend $10k+ for an in-depth audit.
Getting a quality audit is not necessarily easy or cheap, but the good news is, if you understand the process, you can do it yourself. That way, you get all of the benefits you would from hiring an optimization or growth consultant, and you can save a lot of money.
I’ve outlined a five-step process for running a product growth audit below.
When not to run a growth product audit?
You should understand when (and if) it makes sense to run a product growth audit. It’s not a trivial endeavor, and you should be sure your company is ready to benefit from it.
You should not run a growth audit if:
You are still working on achieving product-market fit or growth strategy. In this case, focus on customer discovery and refining your core product experience first, and leave this exercise for when you’re seeing reasonably solid user conversion and retention rates. *
You don’t have enough users to enable adequate research data. For a typical SaaS company, this might be roughly 10k signups and 1k conversions per month, at the very minimum. **
*Even if you haven't reached product-market fit yet, some of the research methods I discuss below might give you some ideas for improving product-market fit. However, you would be better off following a process geared around that specific problem.
**If you target large companies and low conversion volume is expected, you might have to lean more towards qualitative research, or focus strictly on 1:1 interviews.
Now, let’s get into the five-step process.
Step 1: Walk through the website and product
Time required: 1-2 days, depending on product complexity, number of reviewers, and how many screens you need to review.

Start your audit by doing a detailed walkthrough of your top landing pages and product flows.
It's best to do this at the beginning of the audit so your opinions are not biased by the data you've collected. This is mostly about using your user psychology and product knowledge to see what improvements could be made.
Try to put yourself in the shoes of a target user signing up for your product for the first time.
Ask questions like:
What strikes you about each page? What grabs your attention first?
Can you spot any sources of delight or use of emotional design?
What are some obvious sources of friction?
Does the experience feel customized and personal, or is it one-size-fits-all?
Is there a clear and unambiguous call to action? Does the page or screen motivate you to take action?
Is each step, is it clear how you got there and where you're going next?
Feel free to follow a systematic checklist like Jakob Nielsen's usability heuristics or the Wider Funnel's LIFT model.
Tools you'll need:
Screen and voice recording (Loom, Screenflow, Quicktime)
It's a good idea to record your screen and voice as you do the walkthrough, thinking aloud at each step. Pro tip: record full screen, which helps you make sure you get big screenshots you can use to annotate later.
Spreadsheets (Google Sheets, Excel)
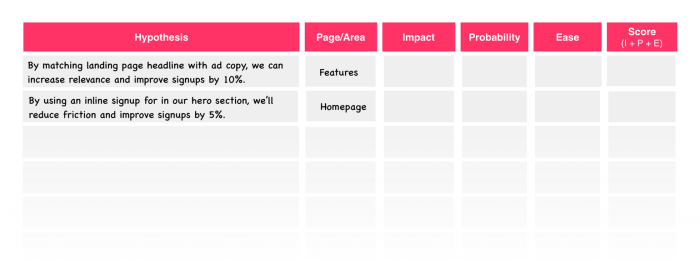
Store notes and improvements in a table of experiment ideas. Start with the hypothesis and the page/section it relates to. At this stage, don't worry about adding too much detail; you're just capturing ideas. To back these ideas up with solid evidence, you'll still need some actual data, which we'll cover in our next two steps.
Your table might look something like this:
Bonus exercise: Group brainstorm
Try getting each of your team members to do their own walkthrough. Then, meet and brainstorm as a group.
If your team is co-located, try mapping out each section of your walkthrough on a wall with sticky notes, then for each area group the ideas into themes (eg., under the onboarding section, you might have a theme for notes related to friction).
If your team is remote, you can use Zoom and team chat, along with a collaboration tool like Google Slides, InVision Freehand, or Miro as a virtual whiteboard.
Step 2: Understand the “what?” with analytics
Time required: 3-4 days, depending on the particular analytics setup.

After your heuristic walkthrough, you'll want to dig into web and product analytics to understand the quantitative aspects of user behavior.
This doesn’t require deep SQL skills or spreadsheet formulas. Sometimes you'll need that kind of data wrangling, but 90% of the time you'll be fine with the built-in reports that come with your standard tools, as we’ll discuss below.
Your goal is to get a high-level overview of the funnel and specific strengths/weaknesses; where should you focus qualitative research? You want to try and understand the root cause of the specific patterns you uncover here.
Tools you'll need:
Basic analytics tools (Google Analytics, Heap, Mixpanel, Amplitude, Snowplow Analytics)
You should have a way to measure the signup rate at the very least and be able to identify which pages get a lot of traffic.
Event tracking (Google Analytics, Heap, Mixpanel, Amplitude, Snowplow Analytics)
As a SaaS company, you need proper event tracking in place. If you don't have anything in place yet, just use the default tracking setup you get with something like Heap or Mixpanel – it will be good enough for this exercise. You just might need to wait a week or two to have some data to play with (the specific amount of time is going to depend on your activation and conversion window).
Zooming out to understand the funnel at a high level
Let’s take a quick step back and think about the flow from website visitors to paying customers. We want to get a sense of the complete funnel (sure, funnels might be an outdated concept... but a high fidelity growth model is not what we're after here, so a simplified picture is fine for this purpose).
Does the funnel look healthy? We want to try and measure that and identify potential problem areas.
For instance, consider two companies with the same 10% trial-to-paid conversion rate:
Company A (20% activation rate, 50% of activated users convert to paid).
Company B (50% activation rate, 20% of activated users convert to paid).
We have two very different stories here. Company A has users who will pay for the product once they get value out of it, whereas Company B might have more fundamental issues related to the product experience, positioning, pricing, etc.
Here’s an example of an ultra-simple funnel report generated for a client:
After taking a look at the funnel at a high level, the next step is to zoom into each specific area to come up with good questions to focus on the next phase of research.
Zooming in to understand the user journey in more detail
At this stage, start pulling Google Analytics (or however you’re doing your analytics) reports to understand your top landing pages and behavior patterns.
Start asking questions like:
What are our top landing pages? Do they convert well, or are users landing and bouncing?
What percent of users are new vs. existing? This gives us some clues on the upside improvement potential.
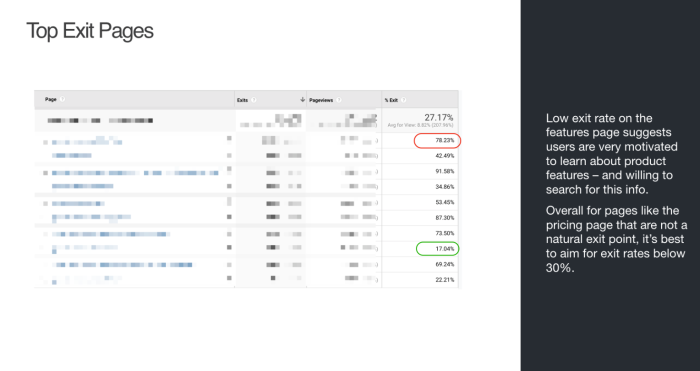
Where do visitors exit your site? If it's not a natural exit point like a Thank You page, chances are there are some sources of friction that need to be addressed.
What is the breakdown of mobile vs. tablet vs. desktop traffic? What about browser vendors? Are there any differences in performance across those segments? If so, are there UX issues at play?
Next, try to pinpoint any key drop-off points with a funnel report. If you can, make use of behavioral cohorts to see if certain user segments activate at different rates.
Questions you should ask will be extensions of the user journey questions from earlier:
Where do the majority of users drop out of our funnel?
What user behavior predicts success with our product? Is this behavior fixed, or can we get more people to do it?
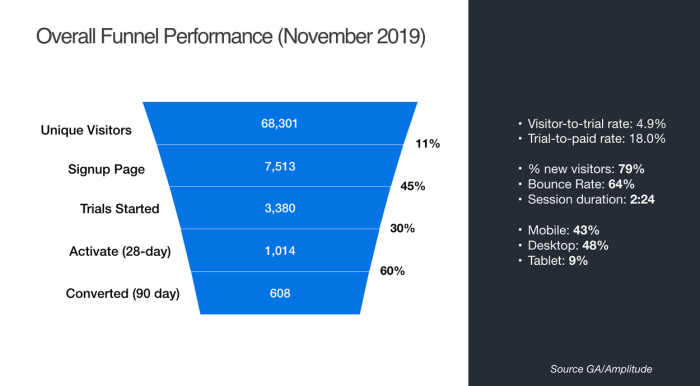
Here’s a funnel report like this will help you see what percent of users make it from one step to the next:
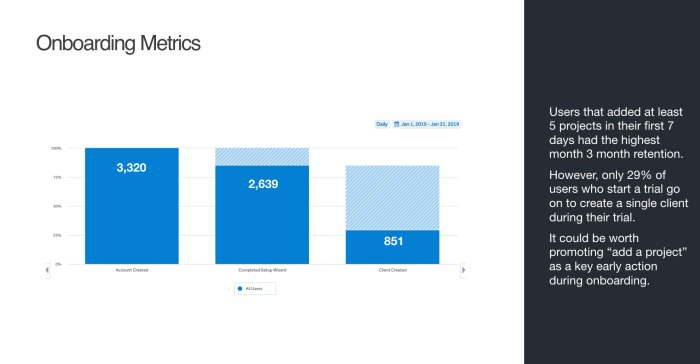
The value of this analysis for generating solid ideas can't be underestimated. For instance, the meditation app Calm found that the behavioral cohort of users who set up reminders was much more likely to keep using the app, so they tested making this a core feature of their onboarding flow and saw a huge conversion lift.
Step 3: Understand the “why?” with qualitative user research
Time required: ~1-2 weeks

Obtain qualitative user insights with usability testing and user surveys.
Up until now, we've been setting our sites on specific problem areas, but we don't yet understand why these problems might exist. To answer that, we need qualitative user insights.
There are a number of qualitative research tools that could shed light on these questions. I won't describe all of them here, and there's already a great framework for that. Instead, I'll focus on the two methods I have found to produce consistently good ideas – usability testing to understand "what people do", and customer surveys to understand "what people say".
Method 1: Usability testing
The idea here is to recruit some target users, give them a task to complete, like signing up for your product and taking a key action.
Observe how they behave. What works well, and why users might be getting stuck?
Don't forget to record these sessions for analysis in step 4!
How do I recruit usability testing participants?
Ideally, find users who are new to your product. You can find them anywhere from user testing panels, Amazon mTurk, or even Facebook, Twitter, etc.
Be prepared to incentivize users to participate. For user testing sessions, this can range from $50-100+ per participant, depending on location and profession (e.g. it will take a much different incentive to recruit surgeons vs. college students).
Aim for about 5 users, which is the sweet spot for usability testing, after which you start to see seriously diminishing returns.
How to design usability testing sessions
First, decide if you want to do moderated or unmoderated tests. I typically do moderated testing with Zoom, as I can make sure the participants clearly understand the instructions. But for some audiences, it might be better to do them in person using a tool like Screenflow or Loom.
Here are some best practice tips for designing usability testing sessions:
No wrong answers: Clearly communicate to testers that it’s the product we're testing, not them – and that there are no wrong answers. Check out Steven Krug's example script for a great way to kick off a user testing study and put users at ease.
10 key pages per 30 minute session: Try to stick with no more than 10 key pages or screens they should visit per 30-minute session. In my experience, expect users to spend about 2-3 minutes on each page. If they rush through, you're less likely to uncover the rich insights you're looking for.
Provide context for the testing: Set the stage by having them put themselves into a scenario, e.g., "It's tax time, and you're looking for software to get your finances in order. A friend told you about FreshBooks, so you decided to check it out."
Begin testing early in the flow: Have users start their test early in the flow, such as on your primary landing page, or even on a Google search page, and have them think out loud as they scan the page, and verbalize their thought process. Ask them if they understand what your product does, and why someone would want to use it.
Get feedback on your pricing page: It's a good idea to have users visit your pricing page and explain your pricing structure. You would be surprised at how often what we think is straightforward pricing can be downright confusing for users.
Get feedback on signup flow: Ask them to quickly go through the process of signing up, either with real or fake data. After signing up, have them rate your sign-up process and whether it could have been easier.
Get feedback on the first key in-product actions: Have users go through the process of taking their first key action in your product. Do not give them step-by-step instructions here, you want to see what path they take to figure it out on their own.
Get feedback on upgrade flows: Lastly, ask users to visit your in-product upgrade page, and ask them how likely they would be to upgrade.
Note: Take note of any interesting moments from these sessions, along with what time they occur (e.g. 5:30 – user confused by pricing). This will make things way easier for you when you analyze the results later.
Method 2: User surveys
While user testing is focused on brand new users with no experience with your product, user surveys should also incorporate users who were successful in your product.
In my experience, recent customers are more than happy to provide detailed questions outlining their experience interacting with your product, what worked well, and what could be improved.
The best kind of user surveys are in-product surveys that capture feedback immediately in the product experience flow.
How to run user surveys
Start by setting clear goals; aim to collect at least 50 (ideally closer to 150) in-depth survey responses from users who converted in the last ~3 months. This is not a quantitative survey, since we're asking mostly open-ended questions. The aim here is rich, in-depth responses from users.
Some best practice tips for running user surveys:
Target recently converted users: Focus on conversions within the past 3 months – ideally in the last month – you want the experience to be as fresh in their minds as possible.
Deliver in-product microsurveys for hyper-relevant responses: Software like Chameleon can deliver in-product surveys to your users. These microsurveys are designed to be un-disruptive and will collect highly relevant user feedback without pulling them out of their in-product flows.
Aim for at least 50 responses: Despite being a qualitative survey, you still want a decent amount of responses. Be prepared to email up to 500 users. You can use a tool like Streak to send this email out directly from Gmail, or use your marketing automation platform.
Give users deadlines for responding: Send your first email early in the week, and let them know they have until Friday to complete their response. Tip: Reminder emails work like a charm, so send another one on Friday to get another boost in responses.
How to design your survey?
Keep it brief: Ask no more than 10 questions. It should really take no more than 5-10 minutes to complete. Aim for mostly open text answers vs. multiple choice. Yes, the analysis will be much harder, but you want to allow for users to answer these questions in their own words, and not bias them towards your own pre-defined ideas.
Don’t forget basic information: Start with some basic demographic questions, including name, age, and industry. This can be super insightful if you decide to segment responses later. You can also ask users to describe themselves to understand what your key customer personas look like.
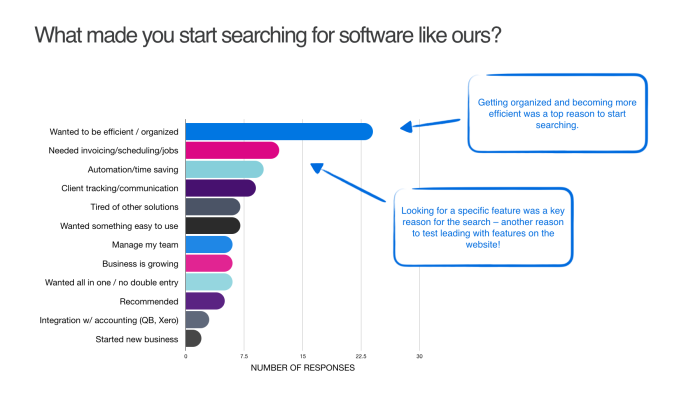
Ask: Why users chose you: To understand what drives users to your site, ask them what made them start looking for a solution like yours. This will help you understand the buying process and customer journey.
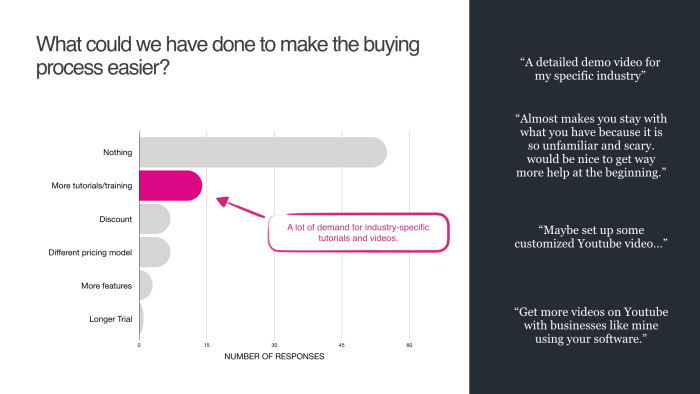
Ask: Why users took a specific action: Questions like: What was the main reason you decided to try our product? What do you see as our product's main benefit? What made you start paying? In-product surveys are a great way to understand why users take specific actions because they allow the user to provide feedback immediately. This means they’re more likely to remember why they took a particular action.
Ask: What are users' biggest fears?: To understand sources of anxiety and friction, ask users what their biggest fear was about using your product, and if there was anything that nearly prevented them from purchasing.
Take inspiration from successful surveys: To save time, search your personal email for survey requests and find one that has a good starting copy for you to use. Be clear that the goal for this research is to improve the product for users like them, and make sure to offer an incentive. Often, giving away a few $100 Amazon gift cards will do the trick.
Note: Don't forget to ask for their email, in case you need to follow up on any responses, or for sending out those gift cards.
For more examples, the folks at Hotjar have put together a big list of survey questions.
Step 4: Synthesize your research findings
Time required: ~1 week

Synthesize data collected so far into a document to share with your team.
After the past few weeks, you should have a mountain of data to sift through. The focus now is to synthesize into bite-sized insights you can package into a shareable document.
Depending on how deep you went, this deck could contain 50+ pages, which is totally fine. But remember, some readers will not have time to go deep into the weeds on this, so be sure to include an executive summary at the start. I also like to include a summary of top positive findings, top negative findings in addition.
Check out an example of what this deck might look like.
How to document your heuristic walkthrough
Add each key step in your walkthrough as its own slide. You'll then want to add key thoughts and ideas on their own slide – just have one key idea to focus on per screen.
It doesn't have to be all negative. Include what you think works well; feel free to include examples of good ideas you've found from researching other companies.
Add one key annotation per screen, where you describe what's working well:
How to document your analytics findings
For your analytics data, just include 3-4 slides showcasing the top analytics findings you generated back in step 2.
Remember that most people will be reading this, and not have the benefit of you being there to explain every piece of the document. So keep your slides laser-focused on one key insight, don't try to say too much.
Check out these great resources on presenting analytics data:
Here’s an example of a slide documenting the website exit rate of various pages, highlighting particularly good or bad examples:
How to document your usability testing findings
Analyzing your user research will take the most time because it's the most unstructured form of data you’ve collected. You should have a process in place to make this as easy as possible.
Tips for documenting usability testing:
Start with high-quality notes: Go back to your notes from each participant so you can quickly navigate to points of interest in your videos. Ideally, you should use video editing software to export short clips that highlight a specific finding.
Provide brief summaries explaining your research process: Make sure to include a summary slide explaining how you did your research, what the task was, and how many users you recruited.
Use screenshots and annotations: For each step in your product where you have findings to share, add a screenshot with annotation and a link to your user testing clips. Share the files via Google Drive or Dropbox and add a link next to your annotation.

Tips for documenting user surveys:
Use spreadsheets for clear categorization: Since you're dealing with a lot of raw text responses, you'll want an easy way to categorize them. The best way to do that is to pull the responses into a tool like Google Sheets or Excel, and begin adding themes to categorize each response.
Develop a process for analyzing survey responses: Thankfully, the team at Hotjar has shared their process (and a template) they use to analyze large volumes of open-ended questions. I wish I found this sooner, it would have saved me many frustrating hours of work!
Illustrate your findings with charts and graphs: After categorizing responses, you can generate nice-looking charts to add to your deck with a graph maker. Then, you can pull interesting verbatim quotes into your charts later on to add more depth.
Add to your list of experiment ideas: Anytime you uncover an interesting insight or hypothesis, keep adding it to your list of experiment ideas. Again, don't worry about prioritizing at this stage, just park them there to categorize later.
Step 5: Prioritize your experiment backlog
By this stage, you should have a pretty good list of 20-30 experiment ideas. The goal now is to go through each one and start prioritizing them.
For each hypothesis, score it on a scale of 1-10 for:
Impact: How much of a difference would this make to our metrics if successful?
Probability: What is the likelihood this will succeed? (Tip: Use the evidence you collected to make this an educated guess)
Ease: How quickly / inexpensively can we implement this?
Then, have a score column that is just the average of these three inputs. Use that to rank your experiments so you know which you can run first vs. which might come later.
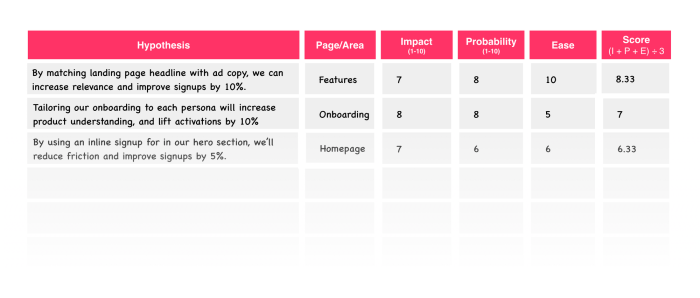
Note: You shouldn't necessarily blindly follow the order in your list. You want to have a good portfolio of tests, so a lot of smaller tests with a high probability of success, but at least once a quarter you should have at least 1-2 big swings – experiments that take longer to implement but could have an outsized impact.
Some final words of advice
So, that's the process you can follow to generate winning experiment ideas. Remember these final words of advice as you embark on running your own growth audit:
Use analytics data wisely: Most metrics you'll see in analytics charts are not that interesting or relevant. Focus on the few key insights or trends that jump out at you, and try not to get lost in the weeds.
Have a goal for your qualitative research: Make sure you take the time to really think about the questions you want to ask, and who you want to ask. When done well, qualitative research will be a source of gold for testing insights.
Be systematic in your analysis: This is the step where you convert vague ideas into concrete insights, so make sure you have a good plan in place for efficiently combing through research data.
Presentation matters: Make sure you think about your target audience for your audit. Include a summary of your findings and make it easy to parse and digest.

Weekly advice to make your product stick 💌
Be the first to get the latest product best practices and resources
This article is written by Mike Fiorillo, founder of optimology, a conversion optimization consultancy focused on SaaS. You can reach him at mike@optimology.co.


