


2020 was certainly… “unprecedented”. The world switched office attire for pajamas and tracksuits, we participated in countless Zoom quizzes, and pets became our new coworkers. But in the world of Product, 2020 will be remembered for other reasons. We saw a shift toward product-led growth (PLG), the rise of the PQL, and a need for tailored user onboarding to drive success.
As we moved to a new year, we took a look back at our end-user data from 2020 and put together our latest Benchmark Report. This report is filled with data from our analytics tool, Mixpanel, that will help you improve your user experience in-product and ensure that you’re optimizing your user onboarding for success.

Download the Tours and Experiences Benchmark Report
We'll send you the report with insights from over 214 million interactions
Product Tours and Experiences Benchmark Report Highlights #
In our report, we look at three key areas; Product Tours, Microsurveys, and Launchers. The data is compiled through averages from our end-users from the entirety of 2020. From this, we’re able to take you through the best practices, show you how different elements impact engagement, and give you tips on how to optimize your user onboarding for product success. Here’s a sneak peek of the most exciting points we uncovered in our research…
How Product Tour length impacts completion rate #
The length of a Product Tour with multiple Steps impacts the completion rate. After single-step Tours, those with three Steps are most likely to be completed—these Tours have a 66% completion rate. After five Steps, the completion rate dips to below 50%, with a strong drop in engagement seen when Tours are more than eight Steps long.
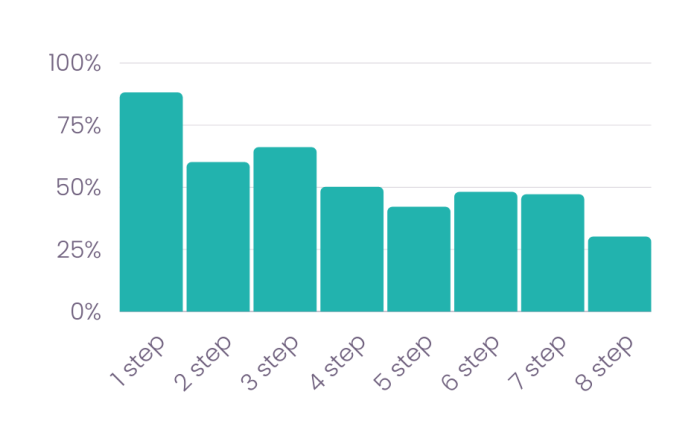
💡 Chameleon Tip: Less is more when it comes to Tour length. Experiment with using different Tour elements to increase engagement—embedded media increases engagement as we show in our report.
How Microsurvey response options impact feedback rates #
Gathering feedback is crucial for product improvements and keeping your CS health metrics in the green—Microsurveys are an excellent way of collecting on-the-pulse feedback while your users are engaged with your product. The average Microsurvey has a completion rate of 60%. But we found that different survey types impact the completion rate. Microsurveys with even-numbered responses collect more responses than odd-numbered Microsurveys, in fact, the average four-option Microsurvey has a 90% completion rate! 🥳
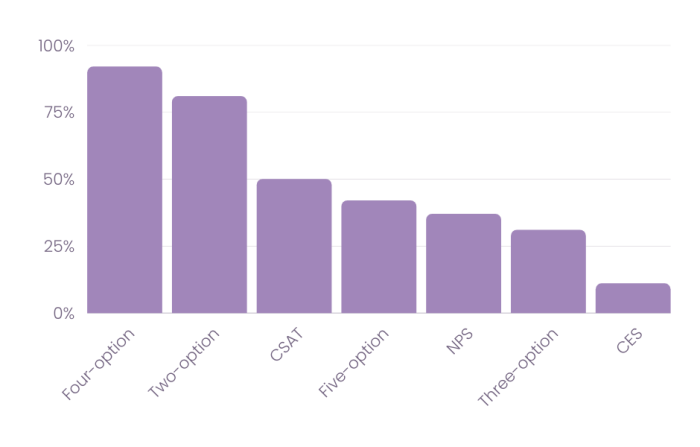
💡 Chameleon Tip: Four-option Microsurveys had an average response rate of 92%! Try using them to gather feedback from your users—they avoid that middle point of “unsure” or “average” and will give you a definitive answer that you can make decisions upon.
How checklist Launchers encourage self-serve learning #
With Launchers, users can complete key onboarding tasks at their own pace—including starting Product Tours. We found that of those users who opened a Launcher, 76% of users went on to start a Tour. Furthermore, of those who start a Tour from a Launcher—the average completion rate is 50% for all Tour lengths showing a clear learning motivation.
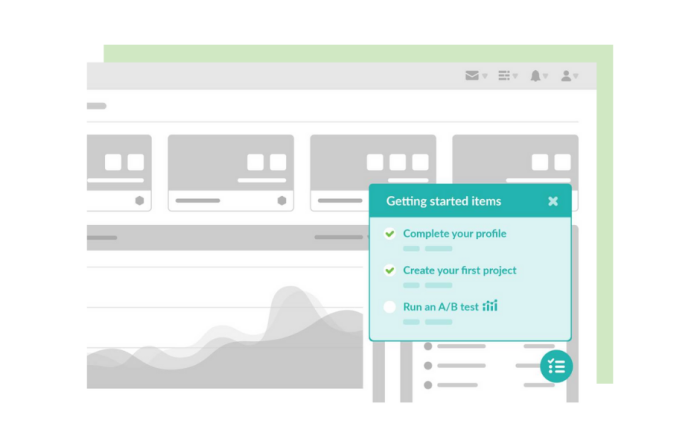
💡 Chameleon Tip: With Launchers, you can show users additional onboarding Tours, Help Center information, or whatever resources you choose to promote. Increase engagement by experimenting with different Launcher icons and designs to show clear updates to your checklist content.
Download the Tours and Experiences Benchmark Report
We'll send you the report with insights from over 214 million interactions

